

Political Scientists and Political Philosophers Aren't More Likely to Show Extreme Patterns in Vote Rate
Political Scientists and Political Philosophers Aren't More Likely to Show Extreme Patterns in Vote Rate

Last year, Josh Rust and I looked at the rates at which political scientists vote, compared to other professors. We also looked at the rates at which political philosophers voted, compared to ethicists in general and to philosophers not specializing in ethics or political philosophy. Our main finding (see here) was that all groups voted at about the same rate, except for political scientists, who voted about 10-15% more often. This fits with our general finding (so far) that by a variety of measures ethicists don't behave much differently than other people of similar social background.
The result that surprised me most from that study, though, and the one I keep coming back to in my mind, was this: The variance in voting rate was the the same (really, virtually exactly the same) for all the groups. I had expected that extreme views about voting -- either about its pointlessness or its importance -- would be overrepresented among political scientists and political philosophers, and that this would be reflected in the voting patterns. Maybe political philosophers aren't any more likely to vote, on average, I thought -- but there'd be a fair number who were highly conscientious, voting in virtually every election, and a fair number who were principled non-voters. If this were the case, they should show a wider spread of voting rates -- or in other words a higher variance. However, we found no such thing.
Excluding the non-voters for a minute, let's look at the distribution of voting rates among the sampled groups: political philosophers, political scientists, non-ethicist philosophers, and the comparison group of other professors, in the following four charts. (Each group gets its own chart. On the x-axis is the number of votes per year, on the y-axis is the percentage of the group that votes at that rate.)
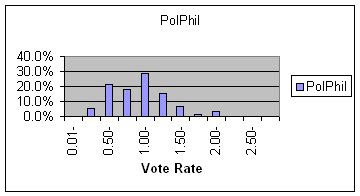
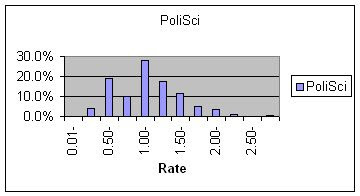
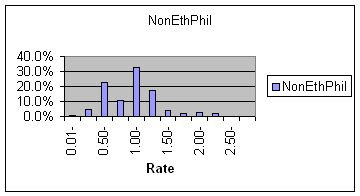
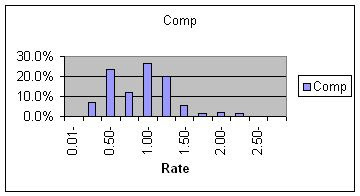
The thing to notice is that there's no more spread in any of these groups than any of the others. Each shows basically the same hump in the middle. (The dip just to the left of the 1.00 votes per year in each group is due to the fact that professors are more likely to vote about once every two years [.50] or about once every year [1.00] than three times every four years [.75]. It's also worth noting that local election data are missing for some regions, so this chart somewhat underestimates the overall voting rate.)
The zeros are a little harder to interpret: For about 25% of sampled professors no voting record was found -- which might reflect a pattern of not voting among those professors, but might also reflect registration under a different name or in a different area. So the following numbers certainly overestimate the number of non-voters. But notice again that there is no tendency for overrepresentation at this end of the scale either, among political scientists or political philosophers (the variations in the percentages here are all within the range of chance variation).
Percentage of sampled professors with no voting record found:
political philosophers: 22.4%
political scientists: 26.2%
non-ethicist philosophers: 29.1%
comparison professors: 26.9%
I find the overall results particularly striking for political philosophers: They are neither, on average, more prone to vote than other professors, nor are they bimodally split between conscientious voters and principled non-voters. Most of them just vote occasionally, sporadically, like the rest of us. It's as though all their thinking about politics has no influence on their voting behavior. (I have other evidence that suggests that it has no influence on their political party, either, but that's for another day.)